Contents
Statistics is the formal science of interpreting data and managing uncertainty, while probability provides the mathematical language to precisely quantify that uncertainty, creating a symbiotic framework for empirical reasoning.
What is Statistics?
Statistics is a formal scientific discipline, operating as a fundamental branch of applied mathematics, that provides the theoretical and practical framework for navigating variability. The discipline is predicated on the systematic collection, rigorous analysis, logical interpretation, and coherent presentation of empirical data. At its conceptual core, statistics is the science of data, but more profoundly, it is the logic of inference under uncertainty. It leverages the axiomatic structure of probability not merely as a tool, but as the foundational grammar for expressing the confidence and limitations of its conclusions. Statistics as a branch of mathematics therefore supplies the principles for transforming raw observations into quantifiable knowledge, allowing us to discern signals from the noise inherent in any complex system.
The History of Statistics
The history of statistics chronicles the intellectual journey from simple state-sponsored enumeration to a sophisticated mathematical science. Its origins as an administrative tool for governance—evidenced by ancient empires conducting censuses for taxation and military conscription—are reflected in its etymology from the German Statistik (“science of state affairs”). This pragmatic function, however, did not yet possess a rigorous theoretical underpinning.
The conceptual revolution began with the formalization of probability theory. The first scientific treatments of probability, emerging from the 1654 correspondence between Blaise Pascal and Pierre de Fermat concerning games of chance, provided the mathematical tools necessary to model random processes. This marked a paradigm shift, allowing future thinkers to analyze variability not as error, but as an object of study in itself.
The 19th century saw the synthesis of these probabilistic foundations with data analysis, propelling statistics into its modern form. Pioneers like Francis Galton and Karl Pearson applied these methods to biological and social sciences, developing concepts like correlation and regression. While the question of who is the father of statistics? points to many contributors, Sir Ronald Fisher’s work in the early 20th century was pivotal. He unified existing theories and developed the principles of experimental design and inferential analysis that remain the bedrock of the field today.
Statistical Measurement Scales: The Levels of Data
Understanding the intrinsic nature of data is a prerequisite for any valid statistical analysis. The question what are the levels of data measurement? addresses this by classifying data into four hierarchical statistical measurement scales, each dictating the permissible mathematical operations and thus the depth of conclusions that can be drawn.
- Nominal Scale: Represents the most fundamental level of classification, where data points are assigned to mutually exclusive categories that lack any intrinsic order. Numerical labels serve only as identifiers, and analysis is limited to frequencies and proportions.
- Ordinal Scale: Introduces the concept of rank or order to the data, allowing for comparisons of “greater than” or “less than.” However, the intervals between ranks are not uniform or quantifiable, precluding arithmetic operations like addition or subtraction.
- Interval Scale: Possesses the properties of order and a constant, meaningful interval between adjacent values. This allows for the calculation of differences but lacks a true, non-arbitrary zero point, which renders ratio comparisons (e.g., “twice as much”) meaningless.
- Ratio Scale: Represents the highest level of measurement, incorporating all properties of the interval scale along with a true, absolute zero. This zero point signifies the complete absence of the attribute being measured, thereby validating all arithmetic operations, including the formation of meaningful ratios.
The Two Major Branches of Statistics
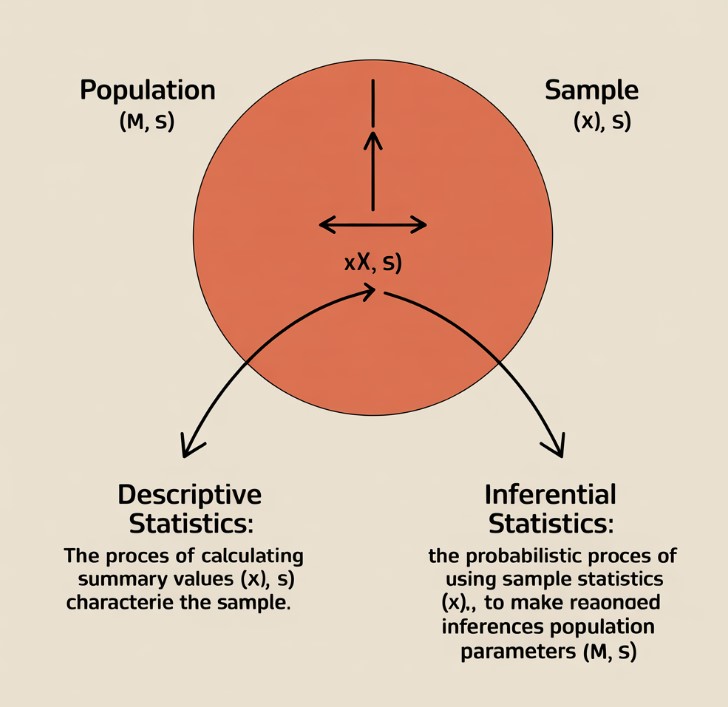
The discipline of statistics is conceptually bifurcated into two principal domains. Answering the question of what are the two branches of statistics? reveals the distinct but complementary functions that define the statistical workflow from data summary to knowledge generation.
Descriptive Statistics
Descriptive statistics provides the foundational methods for crystallizing the essential properties of a dataset, transforming raw numerical chaos into a coherent summary that reveals underlying patterns, central tendencies, and the extent of variability. It is concerned solely with the characteristics of the observed data, utilizing measures of central tendency (mean, median), dispersion (standard deviation, variance), and visual representations (histograms, scatter plots) to distill complexity into an understandable form without making claims about a larger population.
Inferential Statistics
Inferential statistics constitutes the formal framework for making the inductive leap from specific observations within a sample to generalized conclusions about the entire population. This branch is fundamentally probabilistic, as it must account for the sampling error and uncertainty inherent in using a subset to represent a whole. Techniques such as hypothesis testing and the construction of confidence intervals are central to inferential statistics, as they use the mathematical language of probability to rigorously define the confidence and potential error associated with these inferences.

The Importance of Statistics in Modern Life
The importance of statistics transcends its academic origins; it provides the indispensable architecture for evidence-based reasoning in a world saturated with data. Its transversal nature makes it a cornerstone of the modern scientific method and rational decision-making across all domains.
- Scientific Advancement: Statistics provides the methodology for designing robust experiments, objectively analyzing results, and distinguishing between systematic effects and random chance, thereby forming the basis for all empirical research.
- Economic and Corporate Strategy: In business and economics, statistical models are used to forecast market trends, optimize supply chains, assess financial risk, and implement quality control, translating data into actionable intelligence.
- Governance and Societal Well-being: Governments rely on sophisticated statistical analysis of demographic, economic, and social data to formulate effective public policy, allocate resources efficiently, and assess the impact of legislation.
- Technological Innovation: The contemporary fields of machine learning and artificial intelligence are fundamentally applications of statistical learning theory, where algorithms use the science of data to identify patterns, make predictions, and automate complex tasks.
The Difference Between Statistics and Probability
The symbiotic yet distinct nature of these two disciplines is captured in the difference between statistics and probability. They represent inverse logical processes for reasoning about data and uncertainty, as detailed below.
| Feature | Probability | Statistics |
|---|---|---|
| Logical Direction | Deductive: Reasons from a general model or known population parameters to predict specific outcomes or sample characteristics. | Inductive: Reasons from specific sample data to infer the properties of the general model or unknown population parameters. |
| Core Paradigm | Model-to-Data: Assumes the “truth” (the model) is known and calculates the likelihood of observing certain data. | Data-to-Model: Assumes the “truth” is unknown and uses the observed data to construct the most plausible model. |
| Handling of Uncertainty | Quantifies the likelihood of future events based on a predefined stochastic model. | Quantifies the uncertainty of conclusions drawn about a population based on limited, observed data. |
| Illustrative Question | “Given a fair coin, what is the probability of observing three heads in a row?” | “Given a coin was flipped three times and landed on heads each time, what can we infer about the fairness of the coin (statistics)?” |
In short, probability argues from cause to effect, while statistics argues from effect back to cause.
Frequently Asked Questions (FAQ)
What is the main goal of statistics?
The ultimate goal of statistics is to provide a rigorous and objective framework for converting data into knowledge. This involves not only describing phenomena but also making principled inferences about the processes that generate the data, all while transparently managing the inherent uncertainty through the application of probability.
How is probability used in inferential statistics?
In inferential statistics, probability serves as the bedrock for quantifying confidence and error. Since an inference from a sample to a population is an educated guess, probability theory allows us to calculate the likelihood that our guess is correct. It provides the logic for determining if observed effects are “statistically significant”—meaning they are unlikely to have occurred by random chance alone—thereby validating scientific claims.
Can statistics prove something is true?
Statistics does not yield absolute proof in the way formal logic or pure mathematics does. Instead, it provides a powerful framework for quantifying evidence. A statistical test can demonstrate that a hypothesis is highly improbable (leading to its rejection) or that the data is highly consistent with a hypothesis. It operates within the scientific principle of falsifiability, seeking to disprove claims rather than prove them with absolute certainty.


